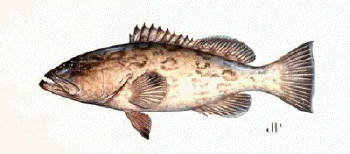
GAG

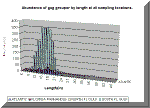
The size (legal & sub-legal) of each target fish (red grouper, gag, red snapper & vermilion snapper) caught per trip, is being recorded. The following length/ frequency graphs show the distribution of that species by the area fished. Fish from neighboring locations were grouped into the nearest area.
Not all of the target species occur in each area, therefore, some areas have fewer graphs than others. This thumbnail, when selected, gives a full size graph showing the location and frequency of the target species
throughout the study area.

|
Tagged and Recaptured Reef Fish |
|
GAG |
Return to Tagging
Return to Fish Biology
Last updated:
June 15, 2004